Net Promoter Score Calculation
How to calculate the NPS score and what is a considered a "Good" score versus a "Bad" score.
Net Promoter Score Calculation — The Formula
Keeping your customers happy is important because you want to make sure they come back, stay subscribed, and recommend you to all of their friends and followers on Instagram, Facebook, and Twitter. Net Promoter Score (NPS) is a customer experience metric that measures how likely your customers are to recommend you to a friend or colleague. NPS isn’t just a popularity metric (although really, what brand doesn’t want to be popular?). NPS is a metric used widely across multiple types of industries–and positive scores have been a reliable predictor of overall business growth and success. By capturing customer experiences in the moment NPS can also help you identify some of your biggest customer pain points to improve your product and set you up for long-term success. But how do you benchmark your organization? What would be considered a “good” score? It’s actually fairly easy to determine some benchmarks.
What’s a Good Score?
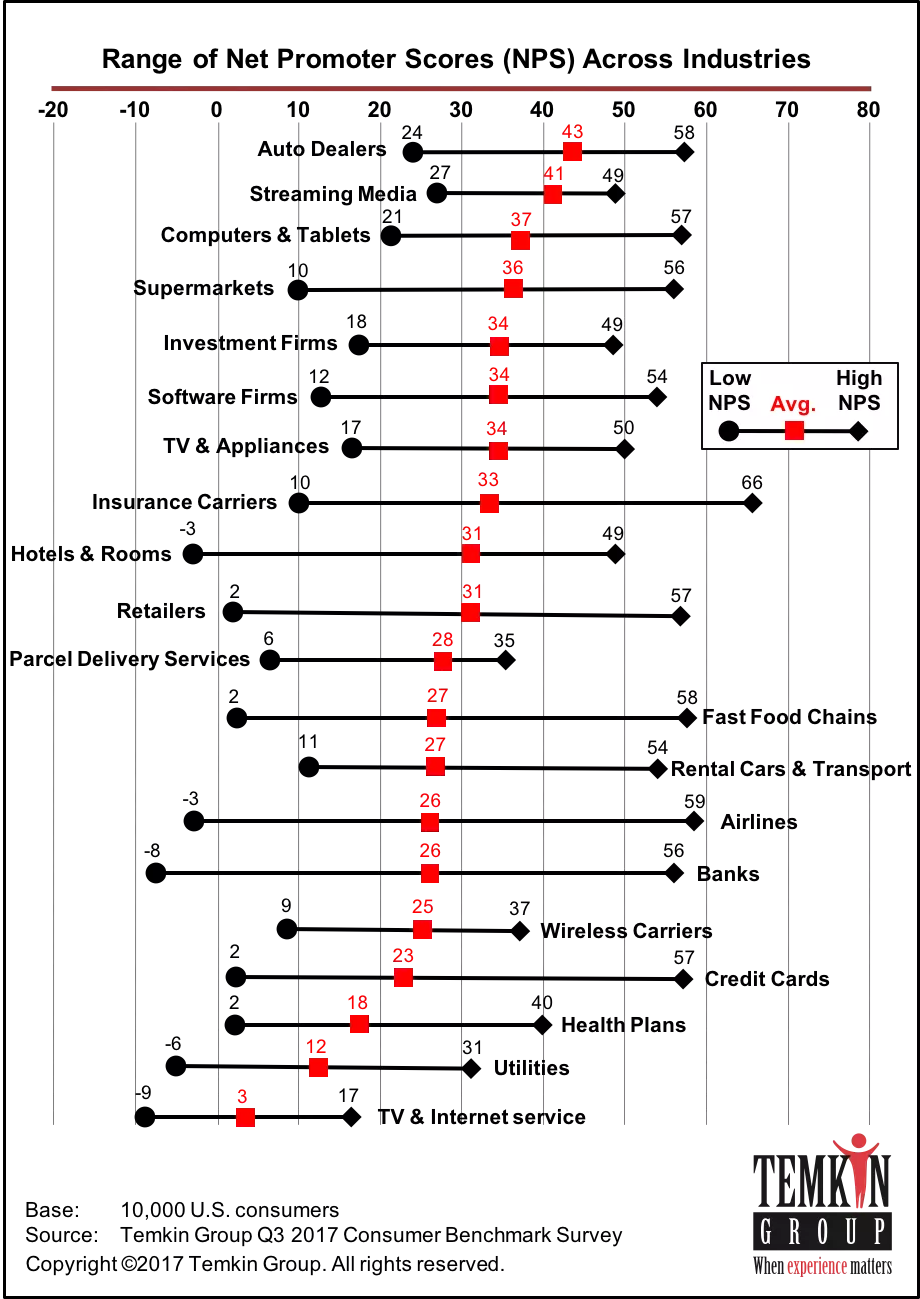
You may be surprised to learn that a company’s NPS can, in fact, be negative. The range of scores goes from -100 to 100, and it’s safe to say that a negative score is, well, negative. So a negative score isn’t good–got it, but how is your score measuring up? As far as determining if your score is “good” or “bad,” it’s helpful to look at the scores of other businesses in your industry because some industries have lower than average scores and benchmarks. Look up the NPS of some of your top competitors as well as some companies that have a similar model.
Below are some of companies you may have heard of before and their respective NPS (as of 10/24/2018).
| Company | Industry | NPS |
| Spotify | Consumer Brands | 24 |
| Vanguard | Banking | 59 |
| Anthem | Health Care | 16 |
| Intel Corporation | Technology | 52 |
By default inside SurveyTown we offer our own assessment of what a good score is. Below are some basic guidelines.
| Less than or equal to 0 | Poor |
| Between 0 and 50 | Good |
| Between 51 and 70 | Excellent |
| Greater than 70 | World-Class |
A good rule of thumb for those of you who don’t really want to do the competitor research is that a score above 50 is good, and above 60 means you’re doing great. You can use NPS to determine how you’re measuring up to customer expectations and how likely your customers are to advocate for you vs. your competitors–but how exactly are NPS scores calculated?
Customer Ratings: Promoters, Passives, and Detractors
To understand the calculation, you must first understand the breakdown of the ratings provided with the question. In an NPS survey, customers are asked, “How likely are you to recommend us to a friend or colleague?” and given a scale of 1 (that’s not going to happen) to 10 (I’m going to tell literally everyone about how amazing you are–go team!). Based on the rating the customer gives, they are then categorized as either a detractor, passive, or promoter.
Customers who give a score from 0-6 are categorized as detractors because it is very unlikely that they’ll be recommending you any time soon, and they’re actually more likely going to leave those one-star, super negative reviews that prevent people from choosing you. Customers who give a score of 7-8 are categorized as passives because they’re not likely to recommend you, but they’re also much less likely to post negative reviews and hurt your business. Finally, customers who give a rating of 9-10 are categorized as promoters because they are very likely to promote you to their friends, colleagues, followers, and random people on the internet.
| Promoters | 9-10 |
| Passives | 7-8 |
| Detractors | 0-6 |
How is the Net Promoter Score Calculation Done?
The NPS formula is a little more complicated than averaging all the ratings together, but it’s not too difficult–we promise. Are you ready?
The formula is:
(Percentage of promoters) — (Percentage of detractors)
Simple, right? If you don’t want to calculate multiple percentages, you can also use this formula:
(Number of Promoters — Number of Detractors) / (Number of Respondents) x 100
Let’s go through an example so you can see how it works. Let’s say you surveyed 100 customers and got the following results:
- 50 promoters (ratings of 9-10)
- 25 passives (ratings of 7-8)
- 25 detractors (ratings of 0-6)
The percentages of scores that are detractors, passives, and promoters are:
- 50% promoters
- 25% passives
- 25% detractors
Now take your percentage of promoters (50) and subtract your percentage of detractors (25), and you’ve got your NPS, which is 25!
Ready for one more example? Let’s turn up the difficulty with imperfect numbers.
Let’s say you surveyed 438 customers and got the following results:
- 64 promoters (ratings of 9-10)
- 98 passives (ratings of 7-8)
- 276 detractors (ratings of 0-6)
The percentages of scores that are detractors, passives, and promoters are:
- 15% promoters
- 22% passives
- 63% detractors
Take your percentage or promoters (15) and subtract your percentage of detractors (63), and you’ve determined that your NPS is -48. This score would be considered a bad one so if this was your business you would probably want to consider taking a hard look at your services and finding areas of improvement.
Net Promoter Score calculations, while not incredibly difficult, can be annoying if done manually each time. Calculating NPS scores is made easier with our easy-to-use NPS calculator. Let us help you skip the math so you can spend more time working on improving your product to raise your score.